


Like most large cities, London has a well-developed urban heat island – an urbanized area that experiences higher temperatures than rural areas. Some parts of the city are also especially vulnerable to heat absorption and retention from the atmosphere and the sun.
Because of this phenomenon, areas of the city with greatest heat island development correlate strongly with temperature spikes, heat stroke, and mortality in the summer months.
Janet Nichol, a Visiting Professor in the Department of Geography at the University of Sussex, wanted to compile data that would be useful for planning and health authorities to know which areas of the city were most at risk of high temperature extremes.
“The increased temperatures in urban areas compared with rural areas is difficult to measure and map spatially, as climatic stations are too sparsely distributed,” she said. “Thermal satellite images can provide a dense grid of temperatures over a whole city, but they are noted for their low spatial resolution due to the weakness of the signal at thermal wavelengths. This necessitates sampling of larger ground areas to obtain a viable, measurable at-satellite signal.”
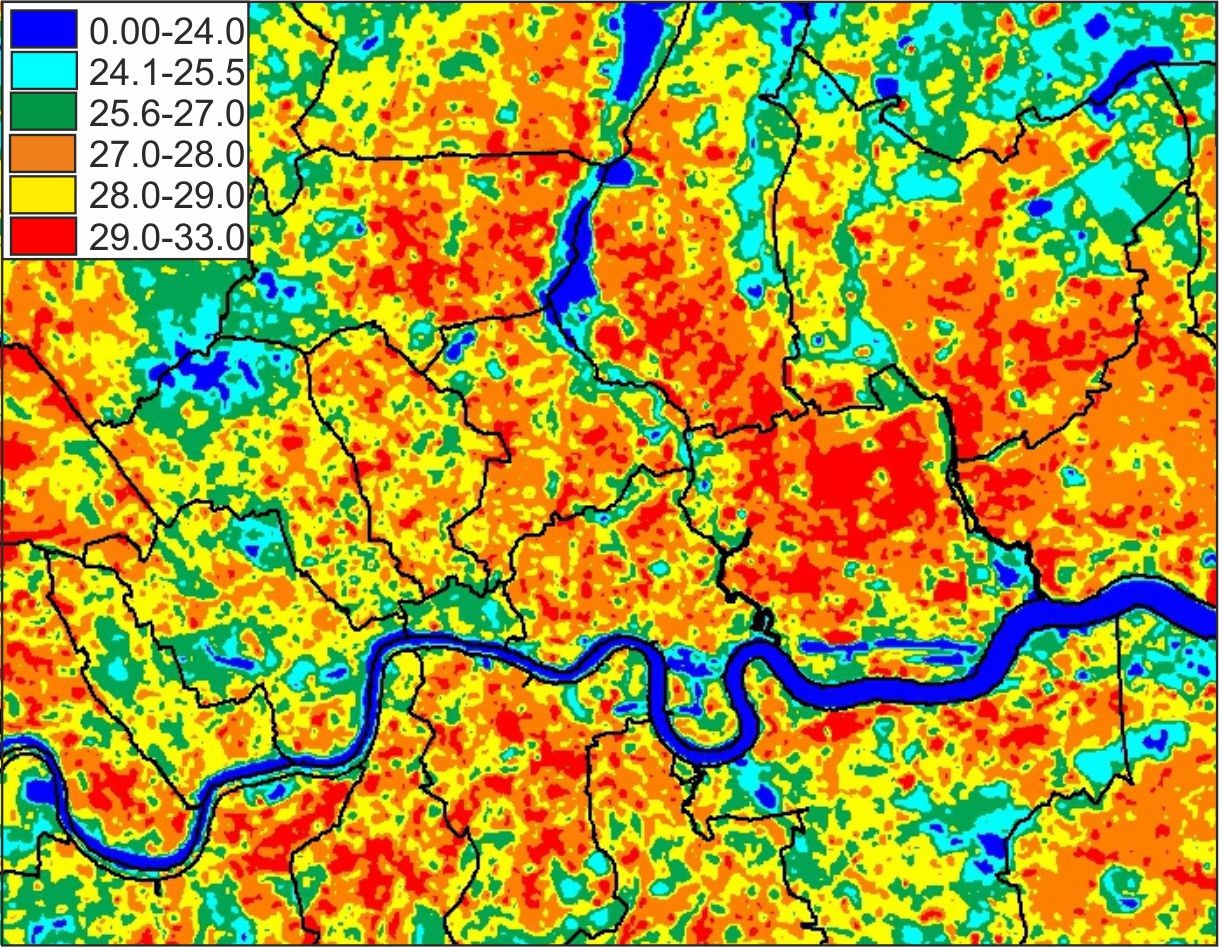
Extract from Landsat 8 OLI Thermal infra-red band of Path 202 Row 24, on 25th July 2019, at 10.58 a.m. GMT. Overlay shows London borough boundaries. Image is converted to LST (°C) and emissivity and atmospherically corrected.
Janet began by obtaining Landsat and ASTER high resolution satellite thermal imagery of London. However, thermal satellite images from Landsat only provide coverage in the daytime, and those from ASTER (which do cover nighttime) were not available for the heatwave period. Moreover, the Landsat thermal images are acquired in the morning around 11 a.m., whereas the urban heat island develops later in the day and during the night.
Data files were also obtained from NASA’s EOSDIS Earthdata hub. The London borough boundary files were downloaded free from London DATASTORE of the Greater London Authority.
Through Janet’s analysis, the initial patterns of warming across the city could be seen in the imagery, and studies that Janet conducted have shown these to be representative of the actual urban heat island development pattern.
Janet used ER Mapper, a satellite and aerial image exploitation tool from Hexagon, to process the images. The ER Mapper functions included image subsetting to extract the London study area from the image. This was followed by image geometric correction, to co-register the Landsat and ASTER images to the WGS84 coordinate system, for overlay of local authority boundaries and street network.
“Hexagon’s ERDAS ER Mapper has easy-to-use functions, including geometric correction, algorithm processing and especially a very interactive image enhancement procedure using histogram manipulation, which is not available in any other image processing software,” Janet said. “Also, the ability to save the algorithm rather than save individual processed outputs, is very convenient and time efficient.
“Mathematical functions and formulas are also very easy to execute using the formulas menu, where individual bands or band combinations can be input to a formula.”
ArcGIS from Esri was also used for the overlying of local authority boundaries, road network and other environmental data onto the thermal image, for further analysis and visualization.
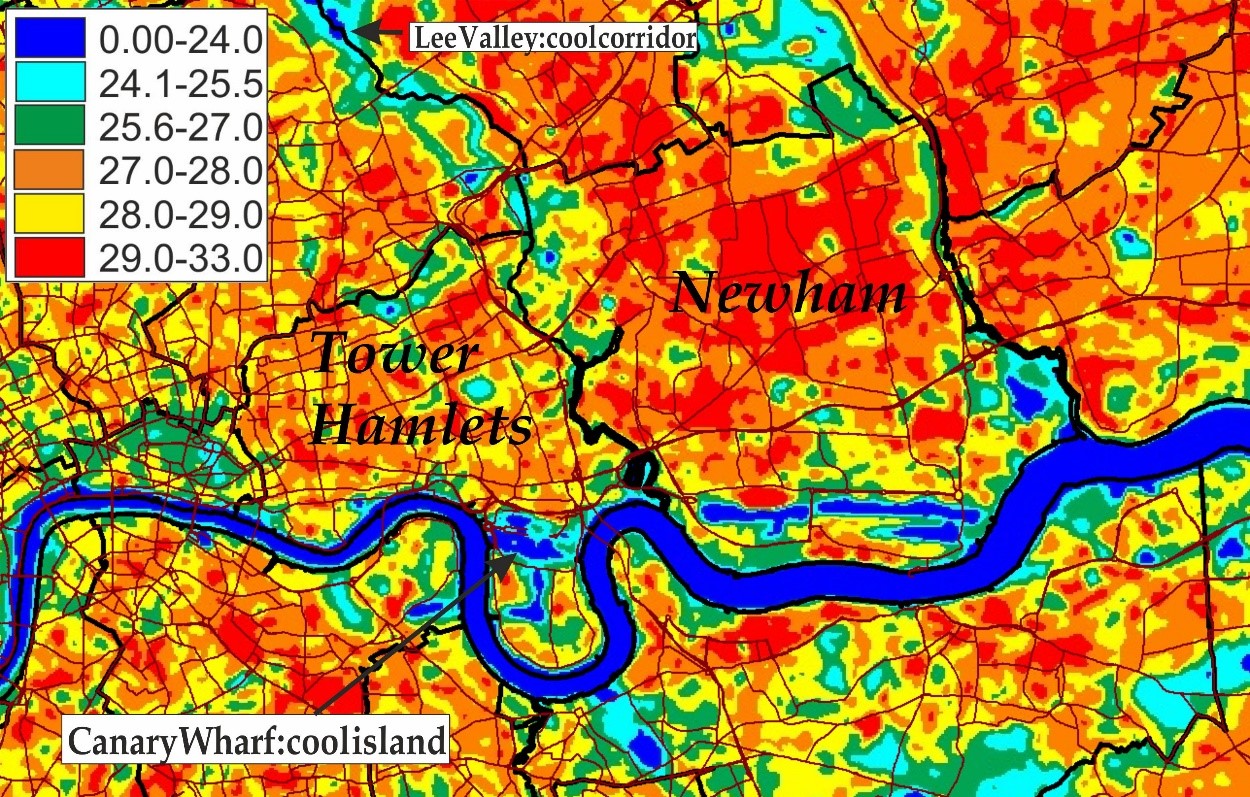
Showing spatial pattern of urban heat island over inner boroughs of East London, with cool island over the high-rise Canary Wharf and along the Lee Valley.
Janet’s image processing led her to create a spatially detailed map of temperatures across London’s inner boroughs and residential districts that she hopes will help with city planning.
Want to see more examples of research using Hexagon technology? Check out the education page on our website.