


Window or aisle seat? Although this can be a difficult choice for some, it’s likely not one many of us have had to make recently.
According to EUROCONTROL, which has been publishing regular COVID-19-related flight traffic reports, average flight traffic in Europe for May 2020 was 85.9% less than it was for the same time last year, and similar trends can be seen around the globe.
EUROCONTROL data also shows that overall, flight traffic is starting to gradually rise, and there were on average 896 more flights per day in May than in April.
With all the multi-source and constantly changing information available regarding flight trends, manually gathering and analyzing it all to understand the current state of global flight traffic can be difficult, and likely also time-consuming. For anyone needing a clear and current picture of flight activity – in a single location, and in a format that’s easy to understand on the fly – M.App Enterprise offers a solution.
M.App Enterprise: Bringing Live Data and Advanced Analytics Together
Hexagon recently configured a smart monitoring dashboard that offers an insightful look at real-time flight data. The OpenSky Network’s live API was used to retrieve real-time airspace information for all in-progress flights globally, and Hexagon’s Xalt | Integration solution connected the data directly to the analytics dashboard view provided by M.App Enterprise.
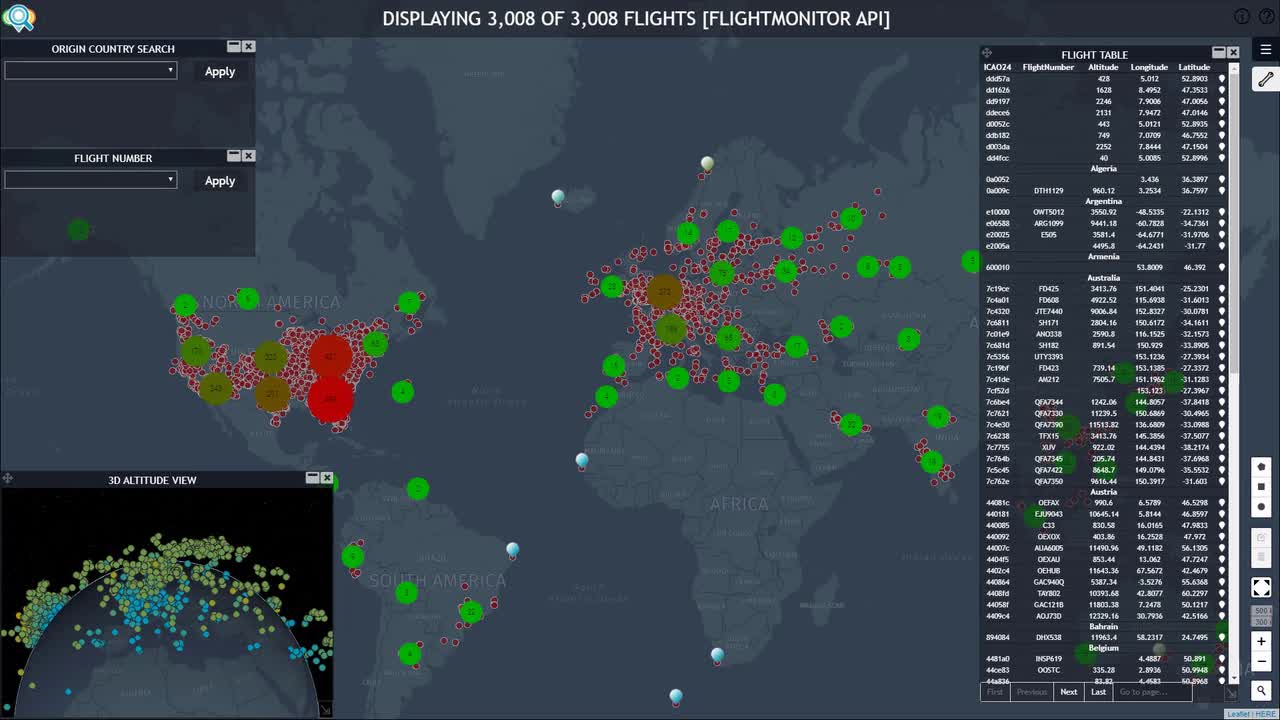
The dashboard gives users the ability to:
- Monitor and track global flights in near-real time
- Access specific flight information and obtain reports with attributes like origin country, destination country, flight height, flight number, and more
- View flight altitude in 3D
- Search for specific flights by number
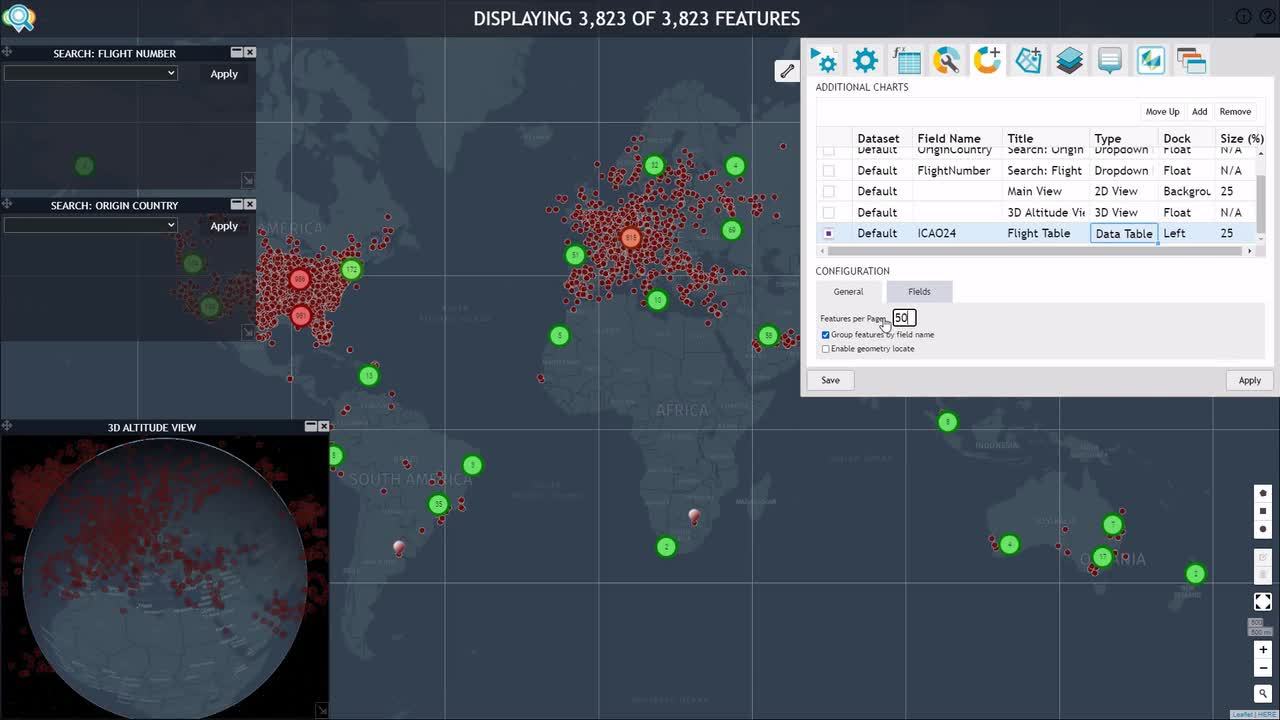
Because the dashboard is based on the highly-customizable M.App Enterprise platform, a user could also incorporate other data sources and even store data over time for historical analysis to understand flight route patterns and determine anomalies, visualize the impact of weather conditions, and determine no-go areas due to conflict areas on the ground.
Want a more immersive experience? Using the 3D capabilities in M.App Enterprise, it’s also possible to view the flight route patterns in 3D.
To see even more possibilities for visualizing and analyzing flight data, take a look at the aviation capabilities provided by our high-performance Luciad Portfolio platform.
Connect Your Live Data Source to M.App Enterprise in Minutes
Viewing an analytics dashboard is great, but it’s even better to know how you can create your own. Hexagon has you covered. If you’re wondering how you can get started gaining new insights, watch our 5-minute demo below on including moving sensors into M.App Enterprise.
Learn more on our website about visualizing data with M.App Enterprise.